Hi all
I’m running data analysis using pyspark through SWAN notebooks and I’d like to “profile” my application so to see where I can improve and whether I could do so by just changing the initial configuration of my spark session.
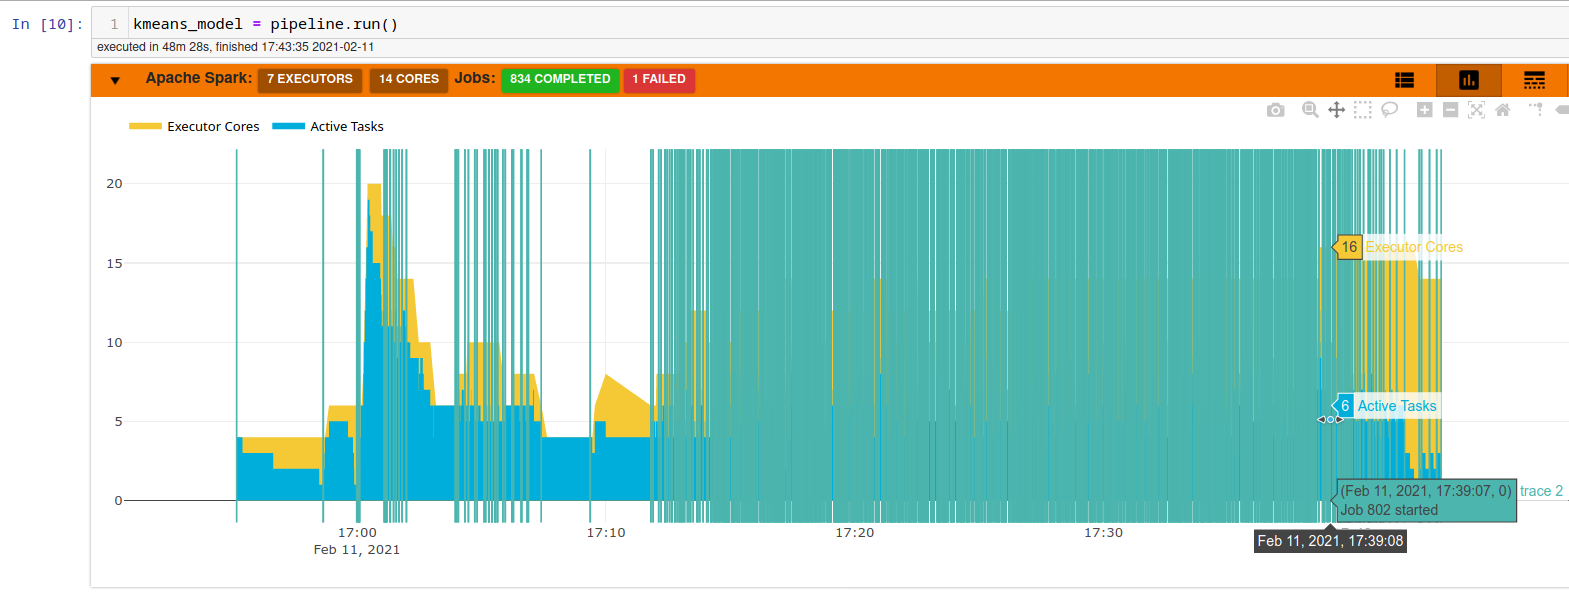
I am aware of the spark monitoring display extension but I’m not sure it fits the purpose (or at least it is not clear to me where to read that information, see example screen below).
Hi @krraghav,
I prepared a simplified but complete version of my application: CERNBox
I basically moved all utils in one notebook in the hope it runs also for other people. I tried to add relevant comments throughout the script in case it may help.
Anyway, I have to say I’m a beginner with spark so I guess some choices may be arguable (e.g. when/how to cache/uncache dataframe to speed up computations, more efficient aggregations, if/how parallelize code, …), so feel free to comment whatever you want. Any suggestion is more than welcome!
Regarding monitoring and performance, if you click on the button that shows the SparkConnector after the application has been launched, you will find a link to the Web UI ( Spark History Server is available here ). From the UI you can see what the different jobs are doing. From there, for example, I could see that a lot of the time is spent in the initial KMeans stages: lots of jobs with this in the stacktrace:
I have looked a bit at your code (the notebook works, thanks!) togeter with @krraghav
I see you are using a ThreadPool to parallelize the hyperparameter tuning, but you could try to use MLlib for that: ML Tuning - Spark 3.0.1 Documentation and maybe include initSteps in the search, if that sounds appropriate for your use case. From what I read briefly online the initial stage of the kmeans algorithm is one of the most expensive tasks of the algorithm, and Spark implements a version developed on purpose to reduce the initial steps.
Hi Riccardo,
first of all thank you very much to you and @krraghav for helping!
I took some time to explore your suggestions and I report some further questions below (I don’t have a great background in “computer science” so I guess my questions may sound a bit naive sometimes, feel free to skip some of them if you think they are too out of the path):
SparkMeasure: I followed the documentation and pip installed the package but I’m not sure how to proceed from there. My understanding is that I should start the spark session passing spark.driver.extraClassPath=<path>/spark-measure_2.11-0.16-SNAPSHOT.jar but I don’t know where that .jar should be. In fact, if I try:
from sparkmeasure import StageMetrics
stagemetrics = StageMetrics(spark)
I get:
---------------------------------------------------------------------------
TypeError                                 Traceback (most recent call last)
<ipython-input-8-617aa8ffc0b6> in <module>
      1 from sparkmeasure import StageMetrics
----> 2 stagemetrics = StageMetrics(spark)

/tmp/spark-a4fee5d6-7cee-4a7c-b654-834a292067fa/userFiles-46e62c7f-e720-456f-826d-daa70e9e52ec/6139a0e76e29456e82006cd3f3d95903.zip/sparkmeasure/stagemetrics.py in __init__(self, sparksession)
     13         self.sparksession = sparksession
     14         self.sc = self.sparksession.sparkContext
---> 15         self.stagemetrics = self.sc._jvm.ch.cern.sparkmeasure.StageMetrics(self.sparksession._jsparkSession)
     16
     17     def begin(self):

TypeError: 'JavaPackage' object is not callable
(I updated the notebook from last time, you should be able to reproduce it by running the first 2 cells)
On the other hand, if I start pyspark from lxplus as pyspark --packages ch.cern.sparkmeasure:spark-measure_2.11:0.15 it works fine.
ML Tuning: your comment about it was very interesting but I’m not sure it fits my purpose as I’m using an unsupervised model and cross validation is usually devoted to supervised techniques. Anyway, technically speaking I have all the ingredients to run it so I gave it a try using numFolds=2, but unfortunately I got this error when I tried on the full data (see section 1.5.3.1 Parallel with ML Tuning for more details):
Py4JJavaError: An error occurred while calling o8243.fit.
: org.apache.spark.SparkException: Job aborted due to stage failure: Task 0 in stage 12084.0 failed 4 times, most recent failure: Lost task 0.3 in stage 12084.0 (TID 12510, ithdp1109.cern.ch, executor 60): ExecutorLostFailure (executor 60 exited caused by one of the running tasks) Reason: Container from a bad node: container_e21_1613549201414_0044_05_000074 on host: ithdp1109.cern.ch. Exit status: 143. Diagnostics: [2021-02-17 12:31:36.049]Container killed on request. Exit code is 143
[2021-02-17 12:31:36.071]Container exited with a non-zero exit code 143.
[2021-02-17 12:31:36.073]Killed by external signal
I tried to understand what happened using the web UI (see point 3 below), but I wasn’t able to understand the error. To me it seems a memory problem, which is strange since I could run it before. In practice, with ThreadPool I was training a kmean model on all the dataset and the evaluating it on the same whole dataset. Now, I’m splitting the data in 2 folds and alternately training on one half and evaluating on the other, so for example the initialization step is done twice instead of just once and that may be an overhead…but again I’m not sure this is what caused it to fail
the Web UI was not directly accessible since I’m not based at CERN and I had to use sshuttle to redirect my traffic and then I was able to see it. Is this the correct way to use it?
Anyway, I’m not sure how to read its information…for example I tried to monitor the jobs at point 2) and I wasn’t able to understand the resources used and why it failed. Here’s the link, hope you can access it: http://ithdp1101.cern.ch:8088/proxy/application_1613549201414_0044/stages/stage/?id=12094&attempt=0
If you’d have any suggestion that would be very helpful!
you can either put the jar in EOS/CERNbox and then use that path or (and it’s easier) with spark.jars.packages = ch.cern.sparkmeasure:spark-measure_2.12:0.17 when you create the session (2.11 if you use spark2.4, but I see you are using 3.0.1. 2.11/2.12 are the Scala versions that Spark 2 / 3 use, respectively)
It works with 2.11 on lxplus as you should have spark2 there by default (is this pyspark from cvmfs? there are views with spark3, such as LCG_97apython3spark3 or the more recent LCG_99)
I’m not too much into ML, but maybe pyspark.ml.tuning.TrainValidationSplit could help you?
21/02/17 12:42:04 WARN NioEventLoop: Unexpected exception in the selector loop.
java.lang.OutOfMemoryError: Java heap space
	at java.lang.Integer.valueOf(Integer.java:832)
	at sun.nio.ch.EPollSelectorImpl.updateSelectedKeys(EPollSelectorImpl.java:120)
	at sun.nio.ch.EPollSelectorImpl.doSelect(EPollSelectorImpl.java:98)
	at sun.nio.ch.SelectorImpl.lockAndDoSelect(SelectorImpl.java:86)
	at sun.nio.ch.SelectorImpl.select(SelectorImpl.java:97)
	at io.netty.channel.nio.SelectedSelectionKeySetSelector.select(SelectedSelectionKeySetSelector.java:62)
	at io.netty.channel.nio.NioEventLoop.select(NioEventLoop.java:807)
	at io.netty.channel.nio.NioEventLoop.run(NioEventLoop.java:457)
	at io.netty.util.concurrent.SingleThreadEventExecutor$4.run(SingleThreadEventExecutor.java:989)
	at io.netty.util.internal.ThreadExecutorMap$2.run(ThreadExecutorMap.java:74)
	at io.netty.util.concurrent.FastThreadLocalRunnable.run(FastThreadLocalRunnable.java:30)
	at java.lang.Thread.run(Thread.java:748)
21/02/17 12:42:04 ERROR CoarseGrainedExecutorBackend: RECEIVED SIGNAL TERM
21/02/17 12:42:04 WARN BlockManager: Block rdd_18767_3 could not be removed as it was not found on disk or in memory
21/02/17 12:42:04 ERROR Executor: Exception in task 3.2 in stage 12094.0 (TID 12544): Java heap space
21/02/17 12:42:04 ERROR TransportRequestHandler: Error while invoking RpcHandler#receive() on RPC id 5648795526854634388
org.apache.spark.storage.BlockNotFoundException: Block broadcast_12664_piece0 not found
	at org.apache.spark.storage.BlockManager.getLocalBlockData(BlockManager.scala:626)
	at org.apache.spark.network.netty.NettyBlockRpcServer.$anonfun$receive$2(NettyBlockRpcServer.scala:63)
	at org.apache.spark.network.netty.NettyBlockRpcServer.$anonfun$receive$2$adapted(NettyBlockRpcServer.scala:59)
	at scala.collection.TraversableLike.$anonfun$map$1(TraversableLike.scala:238)
You may want to use “fatter executors” with more memory per core by adding custom configuration parameters (they are configured when you start Spark using the “star button”). you need to experiment a bit, I’d say you can try “spark.executor.memory” try 20g up to 60g. Try also increasing the driver memory “spark.driver.memory” to 4g. You can also try more cores per executor: “spark.executor.cores” 4 (your can try also 8).
This is an example of how to run grid search/parameter tuning from a regression task I ran, I believe you can adapt it for your clustering case.
from pyspark.ml.tuning import ParamGridBuilder, CrossValidator
from pyspark.ml.evaluation import RegressionEvaluator