Hi all
maybe it is a root question, instead of a SWAN notebook, but maybe someone here can help. I am reading a root file with histograms and I want to use a function to create several histograms in the notebook. In the notebook I am creating this function:
canvas = {}
f1 = ROOT.TFile("$CMSSW_BASE/src/Analysis/JMEDAS/notebooks/files/ttjets.root")
f2 = ROOT.TFile("$CMSSW_BASE/src/Analysis/JMEDAS/notebooks/files/rsgluon_ttbar_3000GeV.root")

def compareHistogram( variable ):

    h1 = f1.Get("h_"+variable+"AK8")
    h2 = f2.Get("h_"+variable+"AK8")

    h1.SetLineColor(1)
    h1.Rebin(5)
    h1.Scale( 1/ h1.Integral() )
    h2.SetLineColor(2)
    h2.Rebin(5)
    h2.Scale( 1/ h2.Integral() )
    h1.SetMaximum( 1.2*max([h1.GetMaximum(), h2.GetMaximum()]) )

    leg = ROOT.TLegend(0.7, 0.6, 0.9, 0.8)
    leg.SetFillColor(0)
    leg.SetBorderSize(0)
    leg.AddEntry( h1, "t#bar{t}", 'l')
    leg.AddEntry( h2, "RS KK Gluon", 'l')

    canvas[variable] = ROOT.TCanvas(variable, variable)
    canvas[variable].Draw()

    h1.DrawNormalized('hist')
    h2.DrawNormalized("hist same")

    leg.Draw()

    canvas[variable].Modified()
    canvas[variable].Update()
which runs fine and I get the histogram once I run in a different cell something like:
compareHistogram( 'tau21' )
But the resulting histogram does not have the legend:
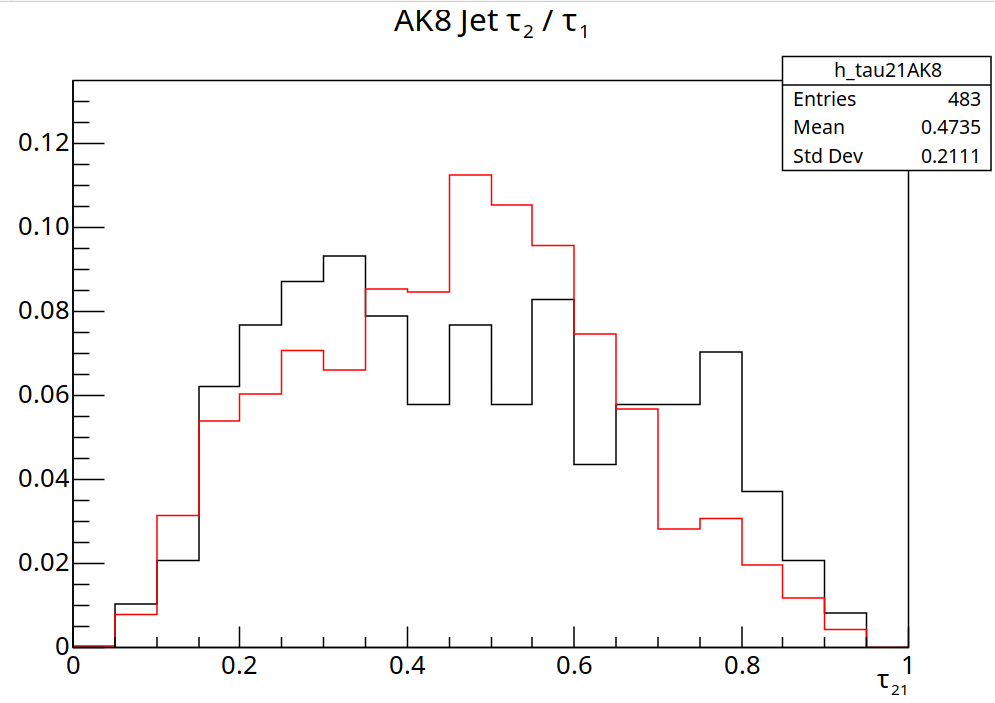
If I dont use the function, and I use the content to create a histogram, everything is fine. Am I missing something?
Thanks for the help.
cheers,
Alejandro
